Energy Monitoring Systems: How Businesses Can Improve Visibility and Performance
Published by Sybel Micro Solutions
Published: 11 September 2026 · Updated: 11 September 2026
A business can have several energy measurements and still lack a clear picture of what they mean. Values may be collected from different points, reviewed at different times or summarized without their operating context. An energy monitoring system is useful when it helps the team connect those measurements with the questions it actually needs to answer.
The aim is visibility that supports decisions. That may mean a clearer discussion about a facility's electrical profile, a more specific investigation of missing data or a repeatable monthly review. It does not mean that installing software automatically produces a saving. Any change in performance depends on the actions taken and the evidence used to assess their effect.
What an energy monitoring system does
An energy monitoring system collects and presents information from defined measurement sources. It can place current readings, historical periods, equipment state and available events in a shared interface. That organization helps people find relevant evidence without beginning each review by assembling information from separate places.
The word “energy” covers several concepts in a real installation. Generation, consumption, grid import and grid export may be measured at different boundaries. The system should make the intended meaning understandable instead of treating every electrical total as the same kind of value. A clear point map is therefore part of the monitoring foundation, not an optional detail added after the dashboards are designed.
Why visibility matters to business users
A facilities manager, an operator and a central reporting team can look at the same installation with different questions. One may need to know whether the measurements are current. Another may want to inspect a change during a particular shift. A third may need a consistent explanation of a completed reporting period.
Better visibility gives these people a common reference: a named source, a known interval and a clear unit. It can make conversations more precise and reduce ambiguity in handovers. The business value should be described in terms of that improved information process, while any claimed saving or performance outcome is assessed separately using an appropriate baseline.
Start with meter boundaries and definitions
Before comparing readings, establish where each one comes from. A meter at an incoming connection and a meter on an internal panel can both be correct while describing different parts of the electrical system. A calculated consumption figure requires an agreed method and suitable inputs; it should not be assumed from the existence of several meters.
Document sign conventions, units and the difference between power and energy. A current-power value is not the same as energy accumulated over a day, and it may not match a demand interval used for another business purpose. The Energy Monitoring System solution explains these distinctions and why they matter in a centralized review.
Make real-time data interpretable
Incoming data is useful only when the user can judge its freshness. A value may stop updating without looking obviously wrong. That creates a risk of interpreting missing information as a stable condition. Availability and timestamps should therefore be considered alongside the measurement.
Agree on expected collection intervals and the responsibilities for investigating a reporting gap. A live dashboard should help the team recognize where information is current and where more checking is required. The Real-Time Monitoring page describes this practical meaning of real time without promising that every device or screen updates instantaneously.
Use device monitoring to explain the source
A site-level observation often needs a device-level check. The reviewer may need to see which equipment supplied a value, which related parameters are available and whether the source remained connected during the period. This context can narrow an investigation before anyone draws a conclusion about the installation.
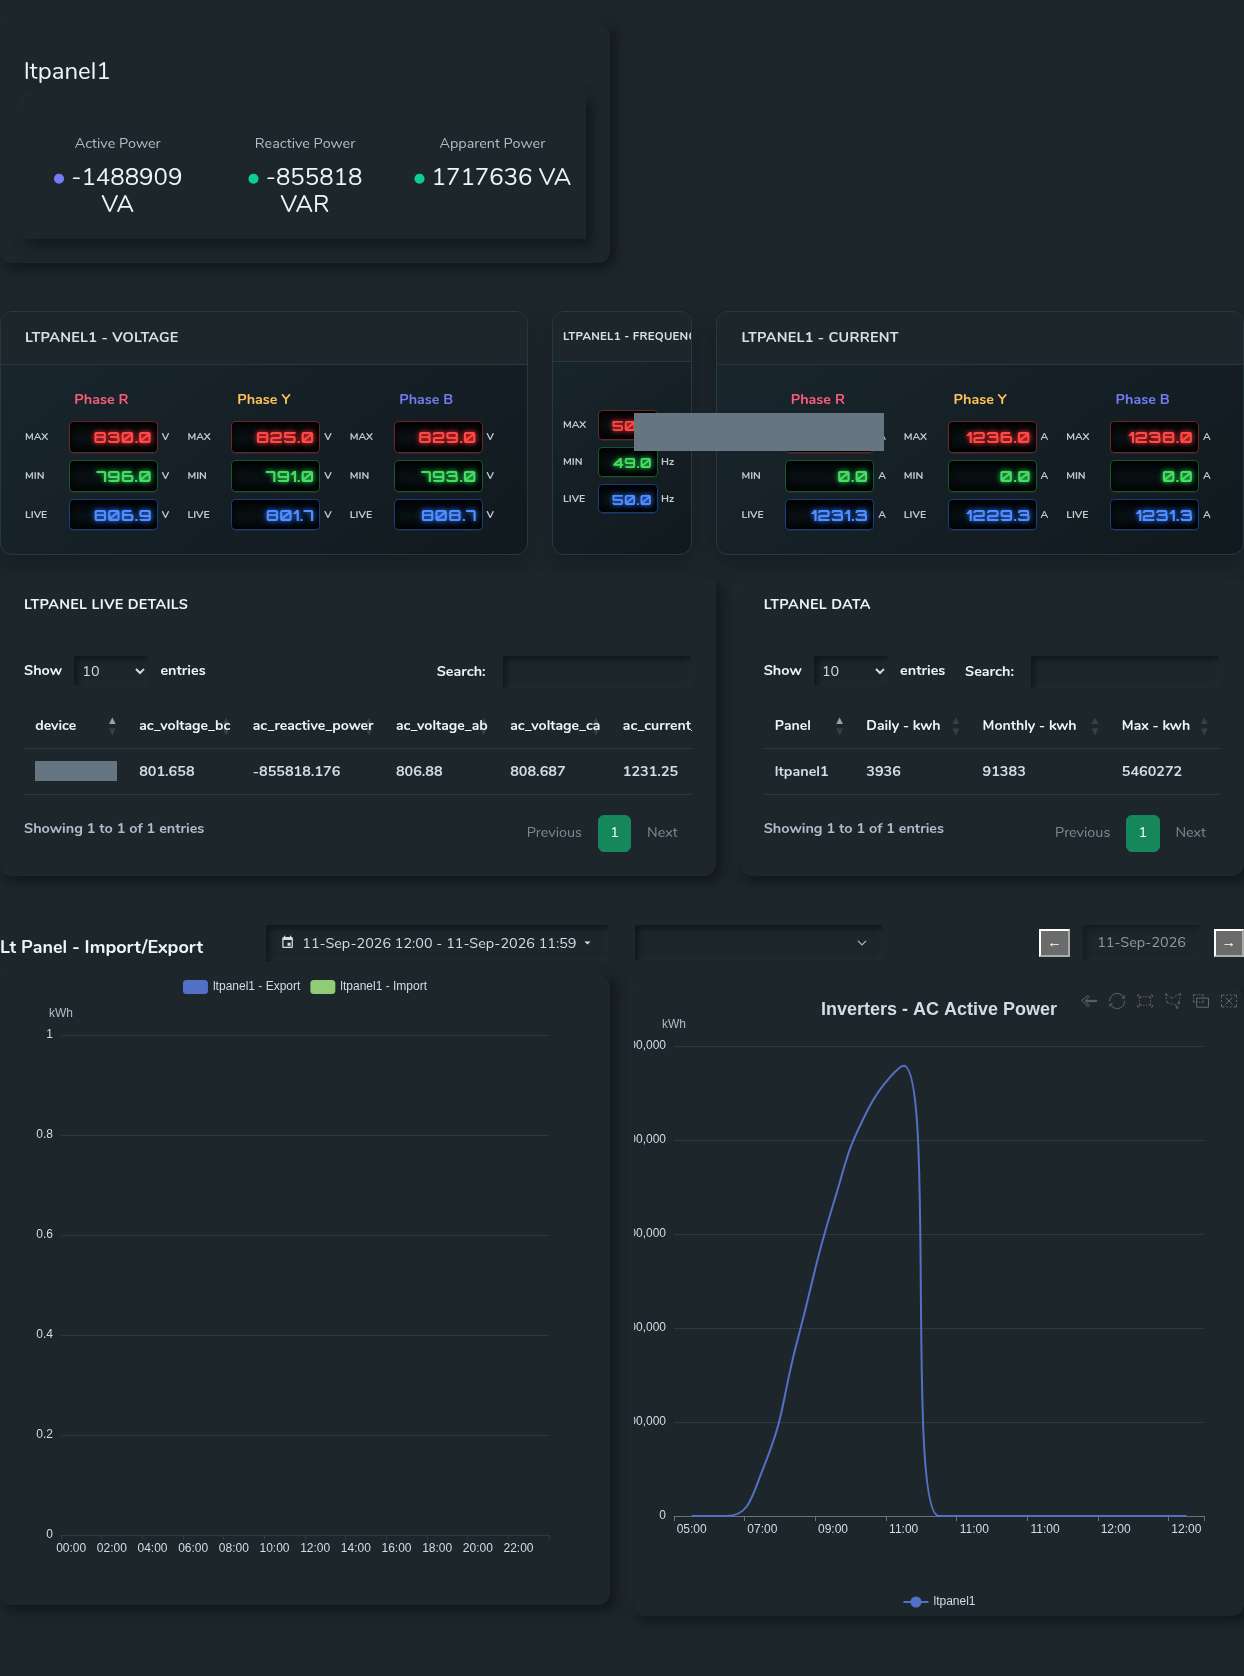
SEMS includes device lists, live telemetry, profiles, availability information and curves, together with inspected meter and electrical equipment views. These are useful starting points, subject to the data supplied by the connected sources. The Device and Inverter Monitoring solution explains why compatibility and point availability should be checked for the actual equipment models.
Design dashboards around questions
A dashboard can become difficult to use when every available value is given equal visual importance. Begin with the routine questions: which sites need attention, whether data is current, what changed in the selected period and where to find supporting detail. The overview should lead to the next useful view rather than attempt to contain every answer.
A central operations team may need a broad site view, while a local reviewer needs detailed electrical context. Both can be supported by a clear route between overview and device information. The design should preserve measurement meaning as the user changes level, so that the same label does not quietly represent a different source or period.
Use analytics to review change over time
Historical analysis makes a current observation easier to examine. A short interval can locate a change, while a longer period can indicate whether it repeats. The comparison should identify any differences in operating hours, collection coverage or equipment configuration that affect interpretation.
Avoid presenting a partial period as though it were complete. A chart with missing data may still look convincing, so the report needs to state its limitations. Energy Analytics and Reporting explains how to select useful periods, define a reporting question and distinguish measured patterns from conclusions about their cause.
Give alarms an operational meaning
An alarm draws attention to a condition, but someone still needs to understand and review it. Establish the source of the event, the expected priority and the role responsible for the next step. Communication events should be considered separately from equipment measurements because they affect the reliability of the information itself.
The SEMS interface includes alarm and fault views and ticket status lists. These can support review and handover, but they do not establish a particular notification channel or service commitment. Alerts and Alarms describes how to connect event information with an agreed operational process rather than treating an alarm count as a measure of completed work.
Make reports useful to their audience
A report should explain the question it addresses, the period covered and the sources included. A technical reviewer may need device context, while a management audience may need a clear summary of observations and open questions. Both need enough information to understand what the figures do and do not establish.
Confirm required outputs in a demonstration before relying on them for a recurring business process. A report category does not prove that every file format, schedule or external connection is supported. State the required fields, permissions and delivery method explicitly, then record what has been demonstrated and what remains outside the agreed scope.
Extend visibility across several facilities
Multi-site monitoring helps a central team organize information from distributed installations, but it does not remove differences between them. Sites can have different measurement boundaries, operating conditions and reporting coverage. These differences matter when reviewing an aggregate or comparing performance.
Use a shared process for freshness checks, period selection and investigation. Then return to local measurements when a site deserves attention. The Multi-Site Monitoring page explains how overview and drill-down support this approach. Central visibility works best when local teams remain part of the interpretation rather than being represented only by a ranking.
How SEMS fits
SEMS is a product of Sybel Micro Solutions focused on solar and energy monitoring. It brings available site information, devices, electrical readings, alarms, historical curves and report interfaces into a centralized platform. The product can be evaluated against the review practices described here through its actual screens.
Explore the platform walkthrough and identify the views relevant to your operation. Protocols, specific device support, deployment architecture, data retention and report exports should be confirmed for the intended project. No saving, compatibility claim or automatic-control capability should be inferred from a general monitoring description.
Take the next step with a clear brief
Prepare a list of the questions your team needs to answer, the measurement sources available and the people who will use the information. Include examples of difficult comparisons or reporting gaps, while leaving credentials and confidential access details out of the initial enquiry.
Request a SEMS demonstration to review that brief. A useful outcome is a shared understanding of the data, the interface and the remaining technical requirements. That is a practical foundation for better-informed operations, with any later improvement assessed through evidence rather than assumed from software adoption alone.
Frequently asked questions
How is an energy monitoring system different from reading a meter?
A meter provides measurements at a particular point. A centralized monitoring system organizes available readings with timestamps, equipment context and historical views so teams can review conditions and investigate changes more consistently.
Can monitoring data explain every change in energy consumption?
No. Readings need context such as operating hours, production activity and the electrical boundary being measured. Monitoring provides evidence, while interpretation may require information from the people responsible for the facility.
Where should a business start with energy monitoring?
Choose a small set of operational questions and identify the measurements needed to answer them. Confirm data quality and measurement coverage before expanding dashboards or comparing multiple facilities.