Energy Monitoring System
An energy monitoring system brings electrical measurements into a shared operational context. Instead of reading each meter separately, a team can review current values, historical trends, device state and site information together. The objective is to understand what is happening at the defined measurement points and identify questions that need investigation.
SEMS supports this approach through site dashboards, meter and device views, historical curves, alarms and reports. Its usefulness depends on a clear description of the installation: which points measure generation, which measure import or export, and which represent an internal electrical boundary. That description is just as important as the visual design of a dashboard.
From a meter reading to a monitoring system
A basic meter reading answers a narrow question about one point at one time. A centralized monitoring system can place that reading beside other measurements and preserve the context needed for review. It helps people see whether the value is current, how it changes over a period, and whether related equipment is reporting as expected.
Consider an operator checking a facility during a production shift. A single energy total cannot explain when a change occurred. A time-based view can help locate the change, while device information can establish whether the data remained available throughout the period. This does not automatically identify a cause; it gives the team a better starting point for a practical investigation.
Define generation, consumption and grid boundaries
Generation, consumption, import and export are related but different measurements. Whether a consumption figure is measured directly or calculated from several points depends on the site's electrical design. A dashboard should not label a value as total facility consumption merely because a meter exists somewhere in the installation.
During planning, identify each measurement boundary and document its sign convention. An export value may use a different sign from the one a reviewer expects. Confirm that the units, collection intervals and equipment clocks are understood before combining readings. SEMS can present the available meter data; the interpretation of that data must reflect the actual site and agreed point mapping.
Review electrical measurements with context
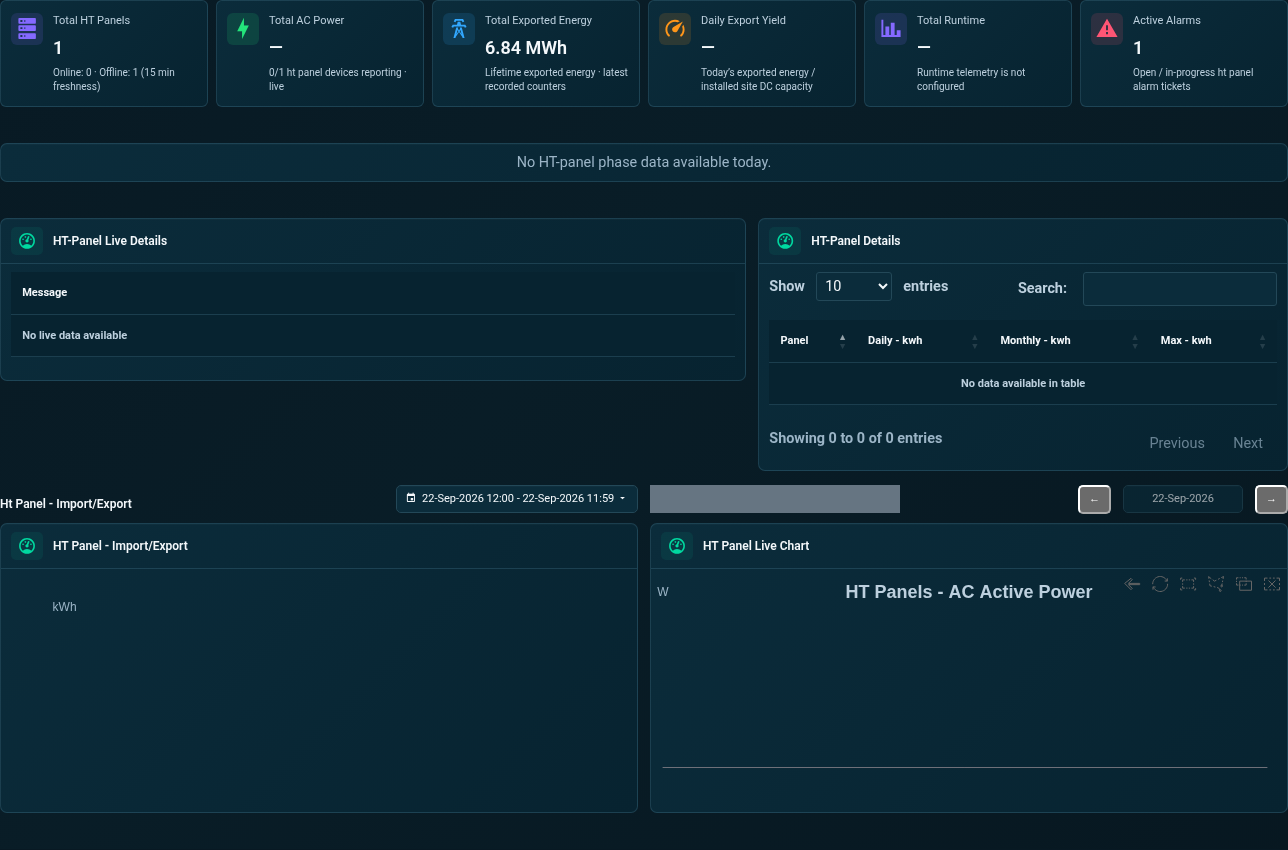
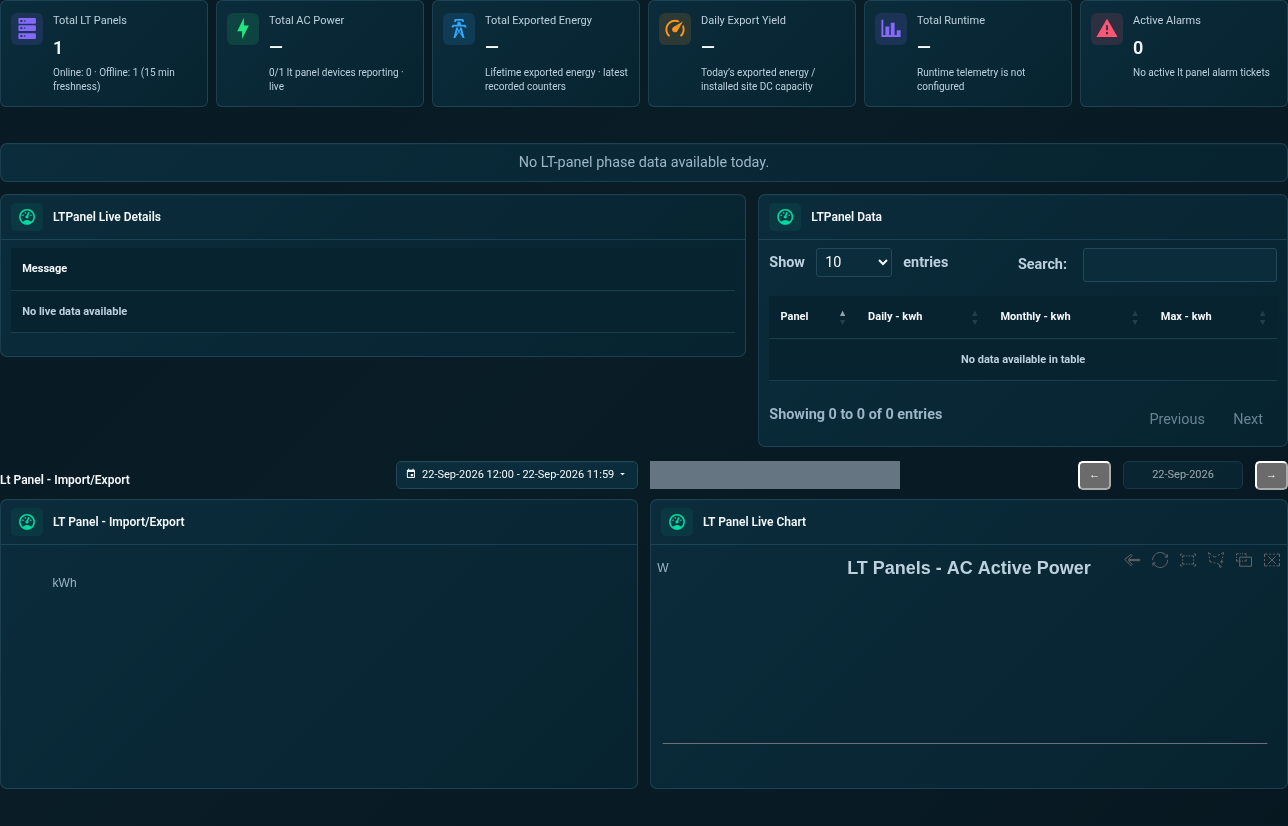
The inspected SEMS interface includes LT and HT panel views, along with electrical parameters such as power, voltage, current and frequency where supplied. Meter-oriented profiles provide another way to inspect available readings. The presence of these screens establishes the kind of operational visibility offered; it does not establish compatibility with every meter or guarantee every parameter at every installation.
Operators can use a consistent set of readings to ask whether a change is localized, whether it coincides with a known operating period, and whether the source remains connected. These questions help avoid unnecessary conclusions from one value. For equipment-specific investigations, continue to Device and Inverter Monitoring and review the meaning of the selected device's telemetry.
Make energy trends useful for the business
Historical information becomes more useful when linked to an operational question. A facilities team might compare periods with similar schedules, while a production team might investigate a change around a planned shutdown. The comparison should account for differences in operating hours and the completeness of the collected data.
Start with a period that the people using the report can explain. Review the trend, identify unexpected intervals and record relevant operational events. Avoid treating a chart as proof of a saving or a fault without corroborating evidence. The analytics and reports workflow describes how to build a repeatable review around measured information rather than an isolated headline number.
Understand demand without confusing it with energy
Power and energy answer different business questions. Energy accumulates over time; a power reading describes a rate at a particular moment or interval. Demand analysis also depends on how an interval is defined. A displayed current value should not be assumed to match a billing demand calculation unless the measurement method has been checked.
SEMS provides visibility into available power and energy readings. If your objective includes demand review, share the relevant meter definitions and reporting interval during discovery. Confirm which historical points are retained and which comparisons are supported. The website does not promise tariff optimization, billing reconciliation or automatic demand control; those are separate requirements that need an agreed technical scope.
Bring facilities and teams into a common view
Centralized energy data can reduce the effort involved in gathering information from separate interfaces. People responsible for a facility can review its local conditions, while a central team can inspect the sites included in its monitoring scope. Shared terminology helps these groups discuss the same event without repeatedly translating labels and measurement boundaries.
The value is operational clarity: a named device, a known period and a clear source for each reading. Establish who owns the data mapping and who responds when a source stops reporting. For groups managing several facilities, multi-site monitoring provides a useful framework for moving between a portfolio overview and site-level detail.
A practical starting point for an energy monitoring project
Begin with the decisions you want the system to support. Examples include checking whether a measurement is current, understanding a daily power profile, investigating repeated communication gaps, or preparing a consistent monthly review. Then identify the minimum set of points that can answer those questions reliably.
Prepare an equipment list, a simple description of the electrical boundaries and a sample of the reports your team currently uses. Agree on how missing data will be represented and what a completed review should contain. SEMS is developed by Sybel Micro Solutions, and the contact page is the starting point for discussing your monitoring scope. The platform tour shows the actual interfaces available for that discussion.
Frequently asked questions
What is an energy monitoring system?
It is a platform for collecting, presenting and reviewing electrical energy information across defined measurement points, with the context needed to interpret readings over time.
How is it different from checking a meter?
A meter provides measurements at its location. A monitoring system can organize multiple measurement points, historical periods, equipment status and operational records in one interface.
Can SEMS show consumption and generation?
SEMS presents available electrical measurements. Which values represent consumption, generation, import or export depends on the installed measurement points and their configuration.
Can historical energy data be reviewed?
The application includes historical curves and report interfaces. Confirm retention periods, supported intervals and the required report content for your deployment.
Does monitoring automatically reduce energy use?
Monitoring provides evidence for investigation and decisions. Any change in energy use depends on the actions taken, operating conditions and a suitable measurement method; no saving is guaranteed.
What should I prepare before requesting a demo?
Provide the site type, meter and device inventory, available data sources, intended users and the operational questions you want to answer. Do not send credentials or private access tokens.
Clear operational context
Actionable performance trends
Real SEMS application screens. Private information has been masked; readings reflect the capture time.
SEMS PLATFORM · 01
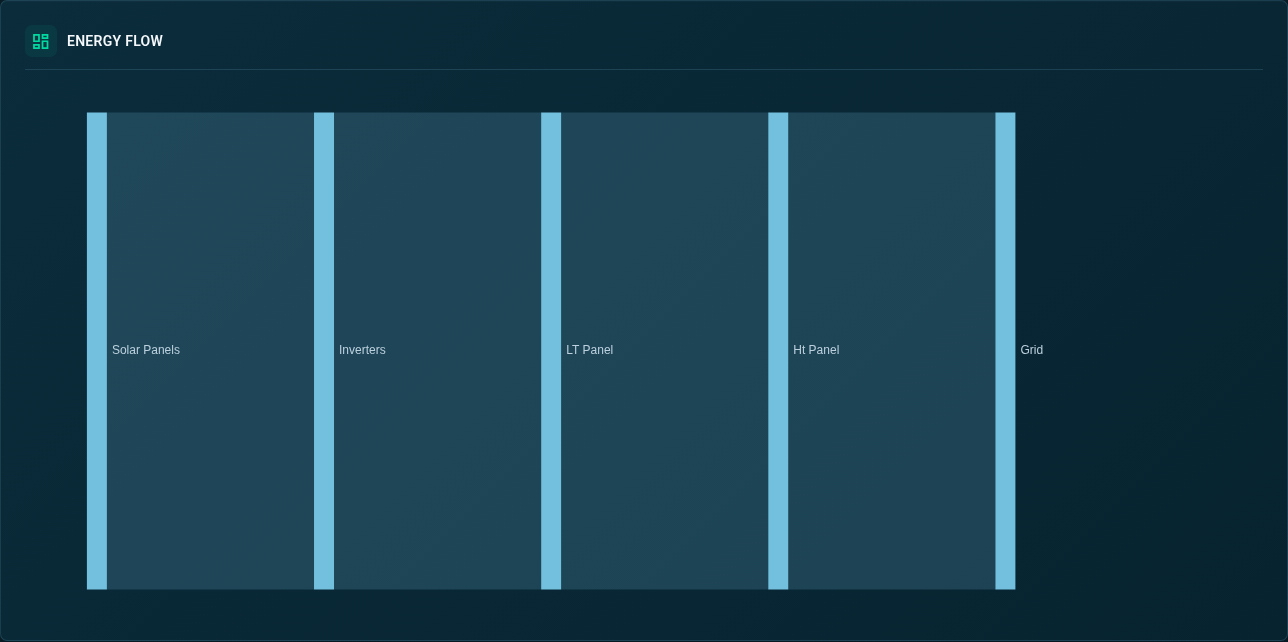
Site Energy Flow
View the energy-flow diagram linking solar generation, grid and load information.
SEMS PLATFORM · 02
Site Dashboard · LT Panel
Review LT panel power, phase voltage, current, frequency, import/export history and trend charts.
SEMS PLATFORM · 03
Site Dashboard · HT Panel
Inspect HT panel electrical indicators, live readings, import/export totals and historical charts.