Energy Performance Management
Energy performance management is a continuing process of defining useful indicators, reviewing measurements and deciding what deserves improvement or investigation. A dashboard supports this process by making evidence visible. It does not replace the work of establishing a baseline, understanding site conditions and checking whether a proposed action addresses the real issue.
SEMS provides generation indicators, site and device views, historical curves and comparisons that can support a structured performance review. The inspected screens also include actual-versus-target presentation and an hourly progressive energy-loss view. Each indicator should be interpreted using its definition, the available measurements and the relevant operating period.
Begin with a clear performance question
“Is the site performing well?” is too broad to answer with one number. A more useful question specifies the measurement, period and expectation. For example, an operator may ask whether a selected inverter followed a similar profile to comparable equipment during a completed day, or whether data availability was sufficient to support a monthly comparison.
Define the question before selecting an indicator. Identify who will use the result and what decision it could inform. This helps prevent dashboards from becoming collections of values that look important but do not guide a review. The analytics and reporting solution describes how to connect a measurement review with the needs of its audience.
Understand the definition behind each KPI
A key performance indicator is useful only when its calculation and source are understood. Energy, power, yield, availability and an actual-versus-target value represent different concepts. The same label can be interpreted differently if the period, measurement boundary or source coverage changes.
When evaluating a SEMS indicator, ask which points contribute to it, what time period it represents and how missing readings affect the result. Confirm the basis of any target rather than assuming it is an independent prediction. An indicator should help people make a consistent comparison, with its limitations clear enough that a new reviewer can understand the same evidence.
Compare expected and actual performance carefully
Expected performance depends on the method used to establish the expectation. A configured target, a historical reference and an engineering model are not interchangeable. A difference from any of them is a reason to investigate, but the explanation may involve operating conditions, configuration, data quality or equipment behavior.
SEMS includes actual-versus-target presentation in its site views. During a demo, establish the source and meaning of the target relevant to your installation. This page does not claim AI forecasting, machine-learning prediction or automatic loss diagnosis. The solar monitoring workflow explains why generation differences need context before they become operational conclusions.
Use historical benchmarking as a disciplined comparison
Historical data provides a reference for questions about change, but not every previous period is a suitable baseline. Operating hours, environmental conditions, equipment configuration and reporting coverage can differ. A baseline should document the conditions that make it relevant and the exceptions that limit its use.
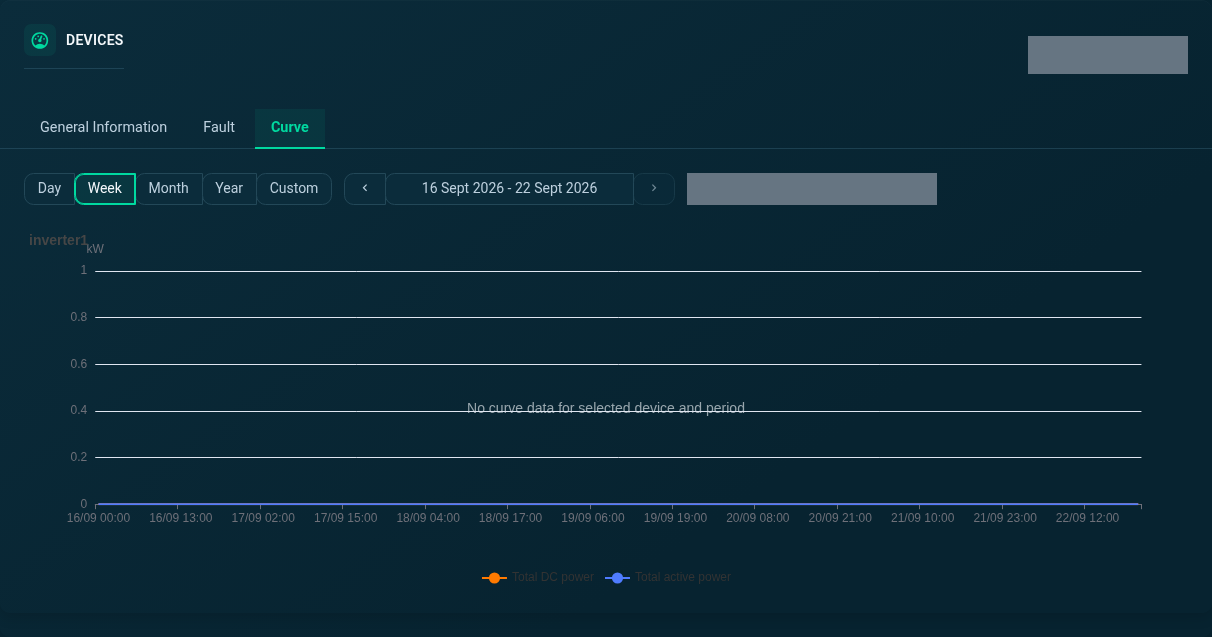
The SEMS curve interface includes several time ranges for selected devices. Review short intervals to understand specific events and longer intervals to see whether a pattern repeats. Keep the comparison period consistent and identify gaps. A careful benchmark states what was observed and what remains uncertain, rather than assigning a performance score without explaining its basis.
Investigate underperformance with several kinds of evidence
A site-level observation may require a device-level investigation. Inverter comparisons, electrical measurements, availability history and alarm records can each add context. Use them to narrow the question: does a change affect the whole installation, a subset of equipment, or only the reporting path?
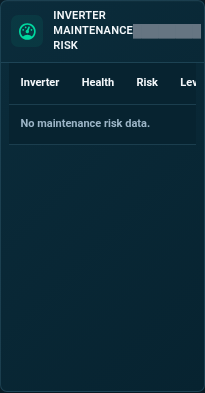
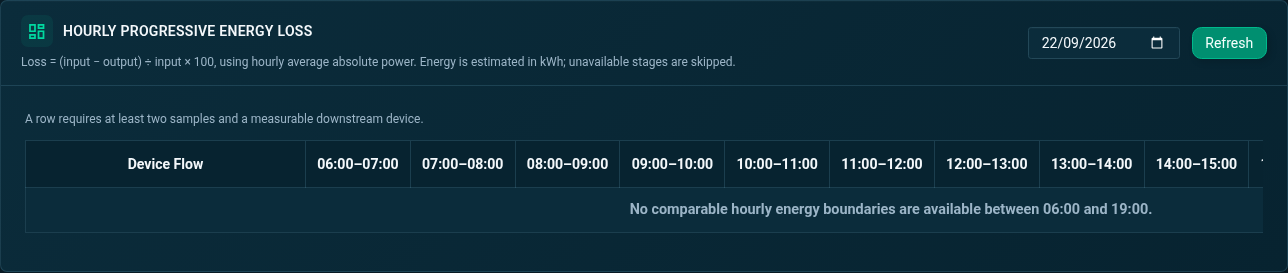
The inspected SEMS application includes an hourly progressive energy-loss view and a maintenance-risk panel. These screens should be discussed in terms of their actual inputs and available data. An empty panel is not a prediction. Device and Inverter Monitoring provides a practical route into the equipment evidence that can support a performance review.
Turn a review into an operational improvement process
A useful review ends with a clearly described next step. That might be checking a measurement definition, asking a local operator for context, reviewing recurring alarms or gathering a longer period of data. Record the observation that led to the action so that the result can later be assessed against the original question.
Monitoring does not guarantee a saving, an efficiency increase or a reduction in downtime. Those outcomes depend on what is changed and how the effect is measured. A disciplined process separates the evidence, the proposed action and the subsequent result. This makes improvements easier to evaluate and prevents an attractive chart from becoming an unsupported business claim.
Apply the same approach across a portfolio
Portfolio reviews need consistency without pretending that every site is equivalent. Agree on the common indicators and allow for relevant local differences. Use the overview to select questions for investigation, then return to site and device detail before deciding what the comparison means.
Multi-Site Energy Monitoring explains how SEMS connects central review with local information. A portfolio team can use this structure to organize attention and reporting, while site teams contribute operating knowledge. Clear measurement definitions help both groups discuss the same issue without confusing scale, reporting coverage or measurement boundaries with performance.
Plan a performance-focused demo
Share the indicators you currently use, the way targets are established and examples of comparisons that are difficult to explain. Identify the decisions your team wants the monitoring platform to support. This lets a demo focus on the required evidence and calculation definitions rather than a generic list of features.
Request a SEMS demonstration or inspect the platform tour. The review should confirm data availability, target definitions and reporting requirements. SEMS can then be evaluated as part of a practical performance-management process, with the expected role of the software and the operational team clearly understood.
Frequently asked questions
What is energy performance management?
It is a repeatable process for defining indicators, reviewing energy measurements, investigating differences and assessing the results of operational changes.
Does SEMS show performance indicators?
The inspected application includes generation indicators, comparisons, actual-versus-target presentation and historical views. Confirm each indicator's definition and inputs for your deployment.
Does SEMS predict failures using AI?
No AI or machine-learning prediction capability is claimed here. The website describes the monitoring and historical views verified in the application.
Can monitoring identify underperformance?
It can reveal differences that deserve investigation. Establishing the cause requires checking data quality, operating conditions and relevant equipment evidence.
Are energy savings guaranteed?
No. Monitoring supports decisions. Any saving or performance change must be measured against a suitable baseline and attributed to the actions and conditions involved.
Clear operational context
Actionable performance trends
Real SEMS application screens. Private information has been masked; readings reflect the capture time.
SEMS PLATFORM · 01
Device Curve · Week
Explore the week view of the selected inverter’s power curve.
SEMS PLATFORM · 02
Inverter Temperature Chart
Review the inverter temperature chart using the available date controls.
SEMS PLATFORM · 03
Hourly Progressive Energy Loss
Inspect hourly energy-loss information across the device flow in the site dashboard.
SEMS PLATFORM · 04
Inverter Maintenance Risk
Review the inverter maintenance-risk table, including its health, risk and level columns.